
Welcome to Next IT Career your best Performance Testing Institute in Hyderabad. We’re the premier destination in Hyderabad for individuals passionate about excelling in performance testing within the realm of Information Technology. Performance testing is a critical aspect of IT, ensuring that software applications perform seamlessly under various conditions. Our institute specializes in honing your abilities and expertise in this vital field.
Why choose Next It Career for performance testing training in Hyderabad?
Industry-Leading Expertise: Learn from industry veterans and experts with hands-on experience in performance testing, providing you with invaluable insights.
Practical Training: Dive into practical, real-world scenarios and case studies to equip yourself with the skills needed to excel in performance testing.
Hyderabad’s Hub: Located in the vibrant city of Hyderabad, our institute offers a dynamic environment ideal for learning and networking within the tech community.
Cutting-Edge Curriculum: Our programs are designed to align with the latest trends and technologies in performance testing, ensuring you stay ahead in this competitive field.
Performance Testing Courses: From introductory to advanced levels, our courses cater to individuals at all stages of their performance testing journey.
Certification Preparation: Prepare for industry-recognized certifications that validate your expertise and proficiency in performance testing.
Customized Training: Tailored training solutions for corporations and teams looking to enhance their collective performance testing capabilities.
What does Performance Testing mean?
Performance testing checks how fast, reliably, and efficiently an application uses its resources when it is under a certain amount of stress. One of the main goals of performance testing is to find and fix the software application’s speed problems. People also call it “Perf Testing” because it is a part of performance engineering.
Performance Testing is all about checking how well a piece of software works.
Why do you need to test performance?
It’s not just about what features and functions a software system can do. The efficiency of a software program is important. This includes its reaction time, dependability, resource use, and ability to grow. Performance Testing isn’t meant to find bugs; it’s meant to get rid of things that slow things down.
Performance testing tells people who have an interest in an application about its speed, security, and ability to grow. Performance testing is more important because it shows what needs to be fixed before the product is sold. If you don’t test the software’s performance, it might have problems like being slow when multiple people use it at the same time, not working right on some operating systems, and being hard to use. Join a performance testing course in Hyderabad and become a pro.
Performance tests will show if their software meets the needs for speed, scalability, and security under the expected tasks. Applications that are put on the market without or with inadequate performance testing are likely to get a bad name and not meet their sales targets.
Mission-critical programs, such as space launch programs or medical equipment that saves lives, should also be performance tested to make sure they work properly for a long time.
Google.com going down for just five minutes on August 19, 2013, is thought to have cost the company as much as $545,000. An Amazon Web Service Outage not long ago caused businesses to lose sales worth about $1100 per second.
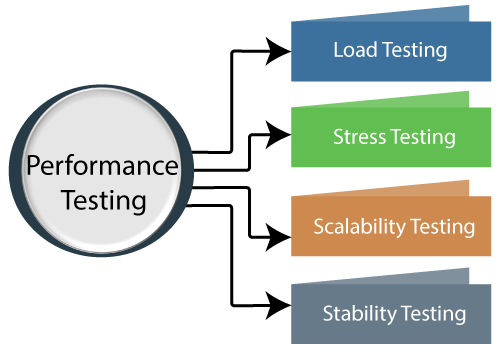
Different Kinds of Performance Checks
Problems with Performance
Speed, reaction time, start time, and not being able to grow are the main issues that cause performance problems. Most of the time, speed is one of the most important things about an app. Potential users will not use an app that runs slowly. performance testing course in Hyderabad makes sure that an app works quickly enough to keep a user’s interest. Here is a list of common performance issues. You’ll find that speed plays a big role in many of them:
Long load time—Load time is the time it usually takes for an app to start up. In general, this should be kept to a minimum. Some apps can’t be made to load in less than a minute, but if you can, try to keep the load time to less than a few seconds.
Poor response time: The response time is the amount of time between when a user enters data into an application and when that application sends back an answer. This should be very quick most of the time. Once more, users lose interest if they have to wait too long.
Bad scalability: A piece of software has bad scalability if it can’t handle the expected number of users or if it can’t handle a wide enough range of users. Load Testing should be done to make sure that the app can handle the number of users that are expected.
Bottlenecking: Bottlenecks are parts of a system that get in the way and make it work less well generally. When mistakes in the code or problems with the hardware slow down speed at certain amounts, this is called bottlenecking. One bad piece of code is often to blame for bottlenecking. To fix a bottlenecking problem, you need to find the part of the code that is slowing things down and try to fix it there. Changing bottlenecks usually means either changing processes that aren’t running well or adding more hardware. Some of the most common speed bottlenecks are CPU usage
How to Test for Performance
While the methods used for speed testing can be very different, the goal of the tests stays the same. It can help you show that your software system meets certain performance standards that have already been set. Or, it can help you see how well two different software systems work together. It can also help you figure out which parts of your software are slowing it down.
step 1: Figure out Your Testing Environment.
Learn about your actual test environment, your production environment, and the testing tools that are out there. Learn as much as you can about the gear, software, and network settings that will be used during testing before you start. It will help developers make tests that work better. It will also help figure out what problems testers might run into during the speed testing process.
Step 2: Figure out the criteria for accepting performance
This includes limits and goals for output, reaction times, and how resources are used. It’s also important to come up with project success factors that aren’t limited to these goals and conditions. Testers should be able to set their own performance standards and goals since the project requirements often don’t include enough different types of performance measures. There may be none at all times. If you can, it’s helpful to set performance goals by comparing your app to one that is similar. This all is explained in
performance testing online training Hyderabad
Step 3: Plan and make tests of performance
Figure out how different end users are likely to use it and come up with key examples to test for all possible use cases. Plan speed test data and make a list of the measures that will be collected. Then, mimic different end users.
Step 4: Setting up the test environment
Get the testing setup ready before running the code. The tools and other supplies should also be put away.
Step 5: Put the test design into action
Follow your test plan when making the speed tests.
Step 6: Test it.
Run the tests and keep an eye on them.
Step 7: Look at, tweak, and test again
Combine, look over, and share test findings. First, make small changes and try again to see if the speed goes up or down. Since gains usually get smaller with each test, you should stop when the CPU is to blame. Then you might want to think about adding CPU power. Join the Best institute for performance testing in Hyderabad to master performance testing.
Operational efficiency Evaluation Criteria: Measurements Tracked
During performance testing, the following fundamental metrics are tracked:
Performance Test Case Examples
When the speed test is actually run, numbers are used instead of vague words like “acceptable range,” “heavy load,” etc. These numbers are set by performance engineers based on what the business needs and how the application works technically.
Testing Tools for Performance Tests
There are a lot of different speed testing tools on the market. The testing tool you pick will depend on a lot of things, like the types of protocols it supports, how much the license costs, what gear you need, what platforms it works with, and so on. Here is a list of testing tools that are often used.
Changes the way we do load tests with LoadRunner. This cloud-based load testing tool lets teams record and play back full load tests right away, without having to deal with complicated dynamic association. These load tests can also be run in large numbers of real computers. Teams can make sure that more tests are run. & lessened the time needed for load tests by more than 60%.
JMeter is the only tool on the market that can do full, ongoing testing. This strong speed testing tool makes apps that work well. Advanced tools, such as fake services, generated test data, and API testing and tracking, can be used by testers. It can handle up to 2 million people.
The most well-known speed testing tool on the market right now is HP LoadRunner. This tool can simulate hundreds of thousands of users, putting real-life loads on apps to see how they’ll respond to those loads. A fake user creator in Jmeter, Loadrunner and Neoload tool makes it look like real people are using the program.
Jmeter training in Hyderabad:
Our Jmeter training in Hyderabad delves into the fundamentals of JMeter, covering its introduction, historical background, versions, supported protocols, and comprehensive features. We explore the crucial question of which applications benefit most from performance testing and delve into the reasons behind the emergence of performance tools. Understanding that JMeter functions differently from a standard browser, we navigate through its operational mechanisms, shedding light on how this performance- hyderabad software testing classes operates.
In our Jmeter online training in Hyderabad, we also cover the essential prerequisite of Java installation for JMeter, guiding you through the installation process for Java Development Kit (JDK) and Java Runtime Environment (JRE). Detailed instructions and commands help verify the successful installation of JDK and JRE, ensuring a smooth setup. We discuss the ideal Java version for optimal JMeter performance and guide you through configuring Java environments and system variables, allowing for seamless integration with JMeter.
Moreover, we cover essential prerequisites for using JMeter and provide step-by-step guidance on downloading and launching JMeter on various operating systems, including Windows OS, MAC OS, Linux, Unix, and Ubuntu. Understanding the significance of different launching modes and the importance of running JMeter from a Command Line Interface (CLI) or non-GUI mode, we navigate the JMeter directory structure and offer an in-depth walkthrough of its application GUI/IDE. Next It Career offers the best JMeter training online in Hyderabad
Throughout the JMeter course online in Hyderabad, we familiarize you with JMeter terminology, highlighting critical aspects and additional points related to the tool’s functionality. By the end, you’ll gain a comprehensive understanding of JMeter’s operation on different operating systems, enabling you to proficiently leverage its capabilities for effective performance testing.
LoadRunner training in Hyderabad:
Our LoadRunner training in Hyderabad navigates through the comprehensive Performance Test Life Cycle, emphasizing key stages like Proof of Concepts (POC), Statement of Work (SOW), and Non-Functional Requirements gathering (NFR) to delineate the test strategy and plan.
It delves into workload modeling, load profiling, scripting intricacies, execution, analysis, and the crucial phase of reporting and recommendations. Module II intensifies focus on LoadRunner Components, delving into the depths of Virtual User Generator (VuGen), Controller, Analysis, Load Generator, and Agent Processes.
Within VuGen, the program explores script recording, enhancements, correlation, parameterization, checkpoints, C functions usage, recording options, and runtime settings, while also addressing LR Protocols spanning Web (HTTP/HTML), API Testing, Web Services, and Ajax TruClient. Additionally, it navigates Test Data Setup, Data Preparation tools like Virtual Table Server (VTS), and Integration aspects involving GIT, ALM, and Micro Focus PC.
Module III of our LoadRunner online training in Hyderabad zooms in on Controller functionalities, differentiating between manual and goal-oriented scenarios, incorporating PerfMon activities, diverse graph types, and decoding Controller error messages. It covers various Performance Testing types, from baseline to volume, stress, endurance, spike, fail-over, and capacity tests. The analysis module peers into client-side metrics like test summaries, running users, hits per second, throughput, and average response time.
Module IV widens the scope, exploring network traffic debugging tools like Fiddler, Developer Tools (F12), and HTTP Watch. It dissects server-side analysis encompassing CPU and memory utilization, server connection distribution, and database utilization.
The training includes exposure to monitoring tools such as PerfMon, Appdynamics, Dynatrace, and profiling tools like Jprofiler/Jvisual VM, and Eclipse MAT, while also dissecting bottlenecks, database monitoring via AWR, and intricacies like memory leakage, deadlocks, and load distribution. It’s an all-encompassing journey through LoadRunner’s intricate functionalities, encompassing both theoretical understanding and hands-on practical learning.
NeoLoad:
In the NeoLoad training program offered by Best Neo Load Training Institute in Hyderabad, Next It career, participants delve into a multifaceted journey covering the core essence of Performance Testing Concepts, emphasizing the meticulous art of Performance Test Script Development. The curriculum extensively covers User Scenario Setup and the nuanced orchestration of Performance Test Executions, while specifically immersing in NeoLoad’s HTTP Protocol intricacies and NeoLoad Web (SaaS) functionalities. Moreover, it delves into the realm of NeoLoad’s RealBrowser Protocol, enabling an in-depth understanding of End-to-End Performance Testing methodologies. The training is heavily steeped in hands-on NeoLoad exercises, allowing participants to grasp Logical Actions within the tool and reinforce their learning through practical applications. Throughout the program, there’s a strong focus on Industry Standards in Performance, empowering learners with the knowledge to craft Project Artifacts and Documentation aligning with best practices in the field.
At the culmination of this course, you’ll emerge equipped with the expertise to craft an effective strategy tailored for load testing within an enterprise system, leveraging the NeoLoad tool proficiently. Beyond NeoLoad, the acquired knowledge extends to encompass core guidelines applicable to any performance testing tool, empowering you to extract maximum benefits efficiently within stringent timelines. Whether you’re navigating the intricacies of NeoLoad or employing a different performance testing tool, this course instills the foundational principles and strategies essential for success in handling diverse Testing tools training in Hyderabad projects, ensuring readiness to tackle challenges with confidence and competence.
It is one of the best tools for checking how well web and application servers handle a lot of traffic.
Our performance testing training programs vary in duration based on the specific course you choose. Typically, our programs range from foundational courses that span a few weeks to more advanced and specialized tracks that might extend over several months. The duration is designed to ensure comprehensive coverage of the curriculum while allowing flexibility for different schedules and learning paces.
At Next IT Career, we take pride in our team of instructors who are industry experts with extensive experience in performance testing. They bring a wealth of practical knowledge and hands-on expertise, gained through years of working in the field. Our instructors are passionate about sharing their insights, providing mentorship, and guiding students through every aspect of performance testing.
Our performance testing training in Hyderabad covers a broad spectrum of tools and technologies used in the industry. From popular tools like JMeter, LoadRunner, and Gatling to performance monitoring tools and strategies, our curriculum is updated regularly to incorporate the latest advancements. You’ll gain proficiency in tools essential for conducting various types of performance tests and analyzing results effectively.
We understand the importance of not just learning but also transitioning into a fulfilling career. That’s why, upon completing our performance testing training, students receive comprehensive career support services. This includes assistance with resume building, interview preparation, and job placement guidance. We aim to equip you not just with skills but also the confidence to secure promising roles in the performance testing domain.
Yes, we offer tailored training solutions for organizations looking to enhance their team’s performance testing capabilities. Our customized programs are designed to address specific requirements and challenges faced by your team. Whether it’s onsite training, specialized workshops, or a customized curriculum, we’re dedicated to meeting your organization’s unique needs in the realm of performance testing.
Copyright © 2025 Next IT Career. All rights reserved.
WhatsApp us